Each month, the headlines shift; but do they actually move the needle on how Australians spend? To find out, Fonto examined its Spend per Customer metric across a range of key categories, comparing March 2026 activity to the same period a year prior. The measure tracks spending behaviour among people who actively purchased in each category, offering a ground-level view of how real buyers are changing their spend over time.
Petrol & Convenience
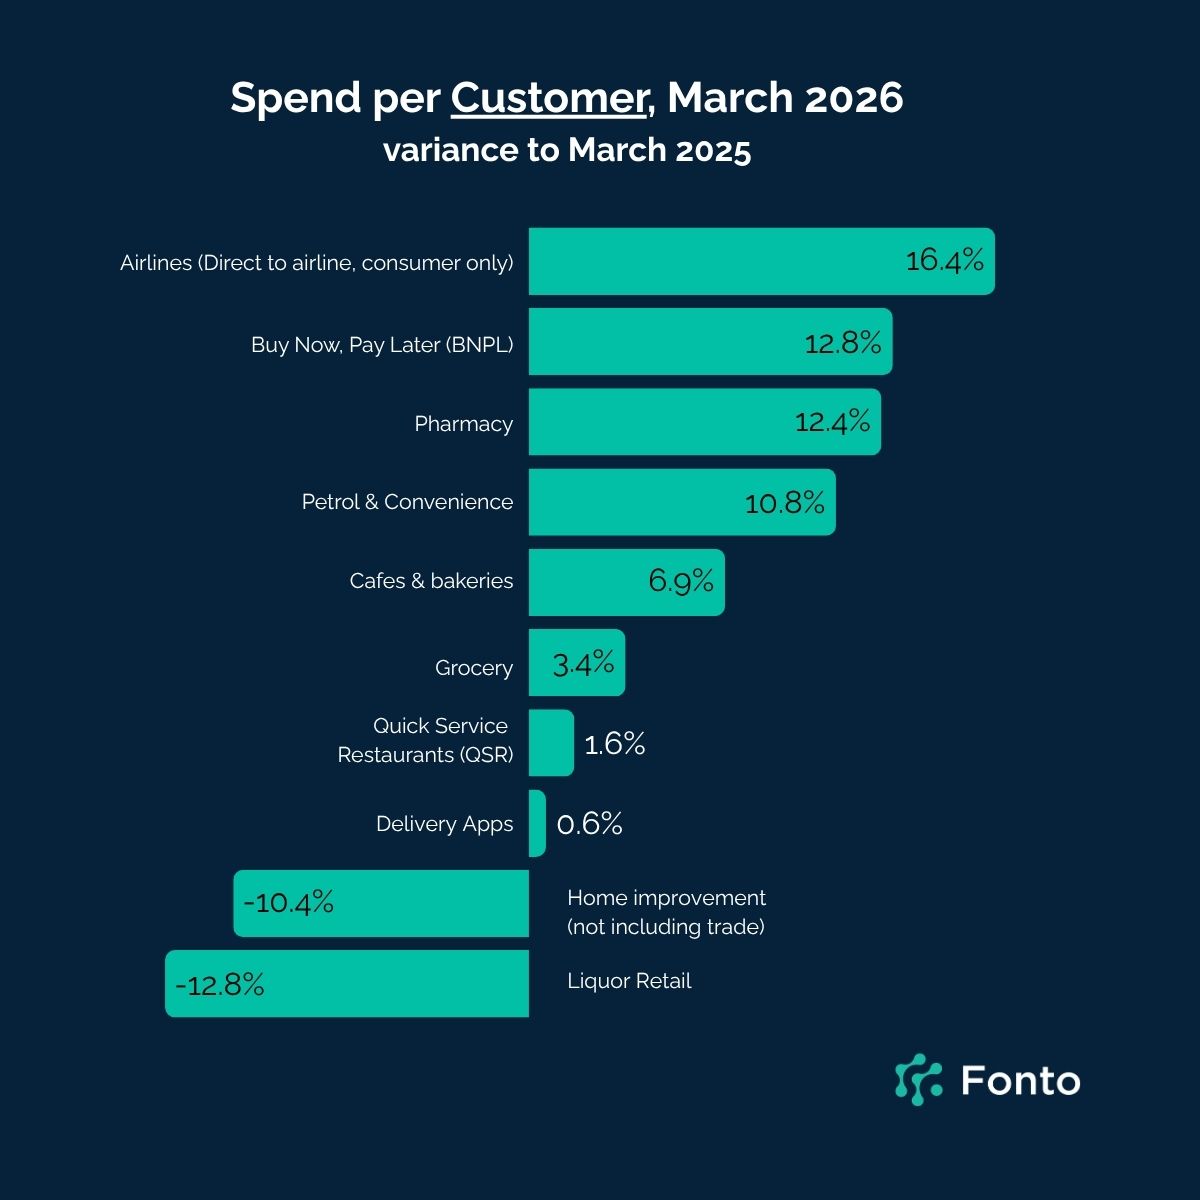
Spend per Customer in Petrol & Convenience rose by almost 11% year on year in March. Fonto's measurement in this category captures both fuel purchases and convenience store transactions, so the uplift reflects a broad increase in customer outlay at the bowser and beyond. It's worth noting that declines in tobacco sales over comparable periods likely offset some of that growth, meaning the underlying fuel and convenience lift may be even stronger than the headline figure suggests.
Airlines: Bigger Baskets Driving Revenue
Consumers booking directly with major airlines (not inluding third-party platforms or agents) increased theirspending by 16.4% in March. The primary driver wasn't more frequent purchases,but larger average basket sizes, suggesting travellers immediately bore the brunt of increasing airfares.
Pharmacy and BNPL: Long-Term Trends Hold Firm
Two categories posted strong year-on-year growth that appears largely independent of short-term global events. Pharmacy spend climbed 12.4%, driven by increased purchase frequency among existing customers. Buy Now, Pay Later (BNPL) shoppers increased their activity by 12.8%, also on the back of more frequent transactions. Both trends reflect structural shifts in consumer behaviour that were already well underway before current economic headwinds emerged.
Liquor Retail: A Continuing Retreat
Liquor Retail continued its downward trajectory in March, with Spend per Customer falling 12.8% year on year. Importantly, this decline predates recent global economic turbulence —it's a trend that has been building for some time, pointing to a more fundamental shift in how Australians are approaching alcohol consumption rather than a reaction to current events.
Home Improvement: Cautious Consumers Pull Back
Consumer spending in Home Improvement dropped 10% year on year in March. Notably, this data excludes trade spend and focuses solely on consumer purchases. The pullback was broad-based: basket sizes, purchase frequency, and market penetration were all slightly down on the prior year — a sign that household discretionary budgets in this space are under real pressure.
Grocery, QSR and Delivery Apps: Steady as Ever
In times of economic uncertainty, everyday essentials tend to hold their ground — and March was no exception. Grocery, Quick Service Restaurants (QSR), and Delivery Apps all recorded modest but positive year-on-year gains in Spend per Customer, ranging from 3.4% to 0.6%. These categories have consistently demonstrated resilience across past cycles, and the latest data reinforces that pattern.
The Takeaway
March 2025's spending data tells a nuanced story. Some categories — airlines, petrol, pharmacy, and BNPL —are seeing genuine growth in how much active customers are spending. Others, like liquor and home improvement, are navigating headwinds that reflect both cyclical pressures and longer-term behavioural change. And at the foundation, the everyday essentials continue to prove their durability regardless of what's happening in the headlines.
Fonto's Spend per Customer metric is drawn from transaction-level data and tracks actual buyer behaviour within each category month on month. All comparisons are year on year unless otherwise stated.